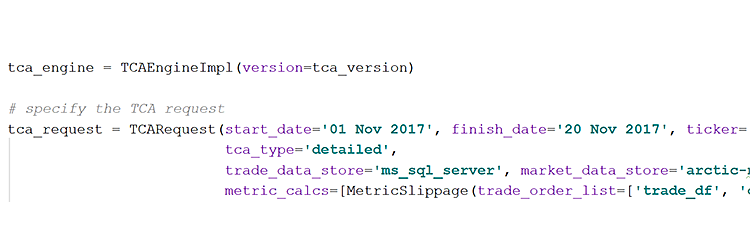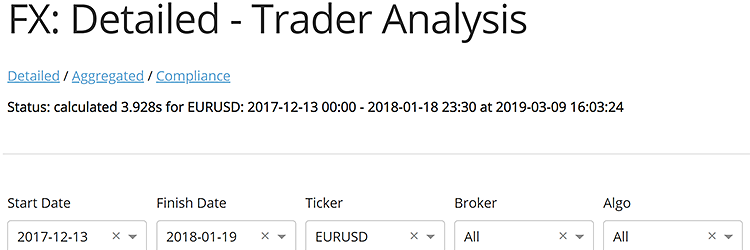
Request a live demo of Cuemacro’s FX TCA transaction cost analysis software, tcapy, which can be used to show best execution by contacting saeed@cuemacro.com. Download a PDF summary of tcapy here. A video demo of tcapy is below, showing how it can be used via its own web GUI, Excel and called programatically. Download tcapy for free from GitHub here.
Video demo of tcapy
What is TCA?
Transaction cost analysis (TCA) as the name suggests is a way to understand your trading costs and hence how it impacts your overall returns and to show best execution. Cuemacro’s tcapy software helps you solve the TCA conundrum for FX, and we’re also planning on expanding it to other asset classes in the future. TCA can involve asking questions like:
- What is my slippage, the difference between a benchmark price and where we executed?
- What is the market impact of my order, in other words how has the price moved since execution?
- What is my implementation shortfall, the difference between the average execution price of an order and the price at arrival?
- And much more!
Why should we do TCA?
The advent of MiFID II, means that traders need to demonstrate best execution (for many different asset classes) and TCA can be done to demonstrate this. However, we would argue that regulation shouldn’t be the sole reason to do TCA. We should also do TCA to make sure we can reduce the costs of our execution which is good for a firm and its investors.
What data do we need to show best execution?
In order to do TCA, we need to have a lot of data to do our analysis, namely:
- Market data – use as a benchmark for our trades
- Trade (order) data – our own fills
How does TCA differ between asset classes?
Each asset class has its own specific nuances when it comes to doing TCA to show best execution. To create a benchmark price for FX spot, to use as a reference for TCA, we can collect FX market data streamed from our brokers, various venues etc., and aggregate that into a benchmark price. Alternatively, we can use a vendor such as New Change FX, which aggregates the market data into an independently sourced benchmark mid. Trade (order) data is sourced from our own trading desk. For other asset classes, like more illiquid instruments in fixed income, it might be more difficult to find quotes from which we can construct a benchmark. We might also choose to augment our own trade data with that of our peers. For FX there is no comprehensive trade tape, unlike in equities, although there is a new product from FastMatch FX Tape, which could be an alternative data source. For fixed income, TRACE data is available for the US.
What about an internal TCA solution?
The next question is how do we do TCA to show best execution? One approach is create a fully internal TCA tool. This has the benefits of being fully customisable. We can modify and create our own metrics. Whilst, many metrics are very standard like slippage, it might be useful to create our own proprietary metrics and also adjust the parameters of existing ones. It might prove to be advantageous if brokers are not fully aware of how we are ranking their performance. Furthermore, you can choose whichever market data source you want to use. This allows us to compare results from prices streamed to us versus an independent benchmark. The drawback of creating a fully internal TCA tool, is that it will be very costly and time consuming to develop and requires significant development expertise. It can also be very costly to maintain such a framework fully internally. Furthermore, once those developers move on to fresh pastures, it is another system for us to maintain with difficulty (hands up who wants to maintain database query code…?)
Or an external TCA solution?
External TCA services are another alternative to showing best execution. It doesn’t require a massive amount of development expertise too. The idea is that we send all our trading data externally to them. They then send us TCA analytics based on our trade data. This is very convenient and can also enable us to compare our performance versus our peers. However, we might prefer to keep all our trading information internally, rather than divulge them to an external party. We should also note that there are emerging solutions such as FX Tape, which could be an alternative way to compare our trades with our peers, without using a fully external service. We can also argue that if a bank is doing TCA there could be some element of a conflict of interest if they are using internally developed libraries (this is somewhat alleviated if we are using an independent TCA vendor though). Another drawback is that we do not have full control of the process. We cannot customise the code to create our own metrics (furthermore, we are not even likely to have any access to the source code). It is also very unlikely that we can upload our own market data, to be able to see how that impact the results.
Is there another way, which is fully transparent and customisable, but doesn’t require a massive amount of internal development time?
There’s a third way, Cuemacro’s tcapy! Transparent and customisable!
Is there a solution, which is fully customisable and 100% transparent, but requires less development time for doing FX TCA? Yes, Cuemacro’s Python based FX TCA solution! Since mid 2017, we have been developing a Python based FX software library, specifically designed for FX markets. Full source code is available for enterprise clients helping to make TCA truly transparent. It allows developers to focus on building TCA customization, rather than spending time reinventing the wheel on the generic parts. All the complexity of handling the market and trade/order data has already been done for you. The software library comes ready with various pre-coded metrics and benchmarks as well. It also has many FX specific features, such as converting trades into a standard quotation form (eg. USD/GBP to GBP/USD etc.). It can be called programmatically as well. It comes with an adapter for getting data from a specific market data vendor and also for accessing trade/order data from SQL databases, as well as storage of market data in a time series database. Every dependency used is open source (or optionally closed source). If you want to use different data sources, however, it is of course customisable. Given it is nearly all written in Python, it is also more accessible, if you do want to make changes, like adding your own metrics. The tcapy library is available to download from GitHub.
What are the benefits of using tcapy for clients?
Clients who have the enterprise edition of our Python based FX TCA library will get massive benefits. As it’s all open source, they get access to 100% of the source code, which can modified and customised. The enterprise licence will also gives you full commercial support from Cuemacro. Cuemacro can also be commissioned to write additional modifications to the software library for clients. We summarise the benefits of using our TCA solution below to show best execution, depending on the user:
- For buy side, it enables you to keep all your trade/order data internal and you have full control over your TCA to show best execution
- For data vendors, we can also build in adapters to make it easy to download your FX data into the library which will encourage clients to subscribe to your data
- For sell side, it gives you an independently created TCA solution, which can more easily be integrated into your systems, as opposed to an external service, and it is much cheaper to maintain than a fully internal solution
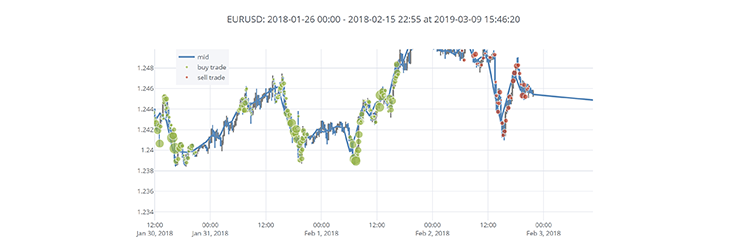
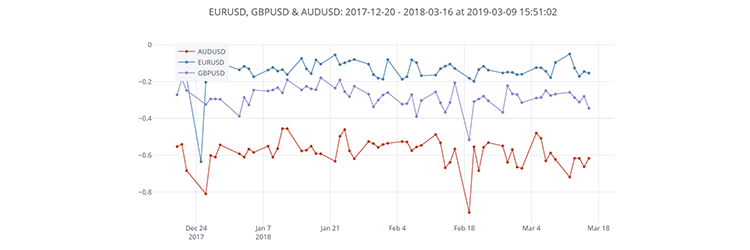
Contact us to learn more about tcapy!
tcapy our FX TCA library is now available on GitHub. It is a great marketing opportunity for sponsors to help support the open source framework. We hope that partially opening up our codebase, will help to crowdsource new ideas for TCA metrics.
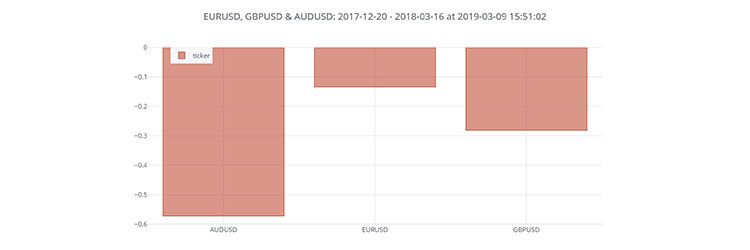
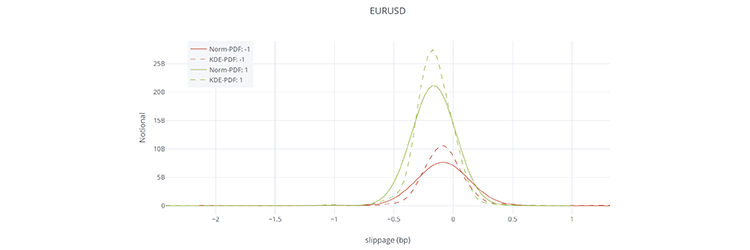
If you’re interested in Cuemacro’s Python based FX TCA library, in particular if you’d be interested in getting an enterprise licence (for commercial support) or sponsoring the partially open source version, let me know! We can show a full demo of the software at your office. Below, we give a small snapshot of some of the analytics available on the web GUI from the enterprise version. It also has many additional displays (which can be customised), including filtering for anomalous trades, calculating markouts, comparing between brokers etc.
